On 16 September my own monitoring flagged my own car’s battery pack.
It was wrong. Worse, when I went looking for the culprit I found the wrong one — I assumed the supercharge that afternoon had done it, and the data says the drive home was twice as bad.
Both of those are worth showing, because the mistake underneath them is the same one that makes owners panic at a cell-imbalance number read off an OBD app.
The short answer
At rest, normal cell voltage spread on a healthy pack is single digits to low tens of millivolts — and it stays there. On my 2017 Model X 100D, logged continuously for 263 days, the resting 95th-percentile spread ran a median of 11.6 mV, and the worst single day across the entire run was 18.0 mV — against a threshold of 30 mV that it never once approached. The resting median is lower still: 6.1 mV.
Spread measured while current is flowing is a different number entirely, and it is not a health number. On 16 September the same pack, on the same afternoon, read 9.5 mV at rest, 73.8 mV while taking a 111 kW supercharge, and 136.9 mV under regen on the drive home.
If a reading alarmed you, the first question is not “how bad is it” — it is “what was the car doing when that number was captured”.
One disclosure before the numbers: the pack in this car is a warranty replacement, not the original 2017 pack. Everything below is real data from a real car, but it is a younger pack than the badge suggests, and pack-level figures should be read with that in mind.
What cell spread actually is
A Model X pack reports the voltage of each of its cell groups. Cell spread is just the difference between the highest and the lowest at a given moment.
It is a genuinely useful health signal, because a cell group that is failing tends to drift away from its neighbours and stay there. That is why battery apps surface it, and why a big number is frightening.
The trap is that a cell group’s measured voltage is not the same thing as its state of charge. Voltage under load includes a resistance term:
measured voltage ≈ open-circuit voltage − (current × internal resistance)
At rest, current is nearly zero, that second term vanishes, and what you read is close to the cell’s actual state. With 280 amps flowing, that term dominates, and ordinary manufacturing differences between bricks — a few tenths of a milliohm — turn into tens of millivolts of apparent spread.
There is a second effect, and it turns out to be the bigger one. The pack does not report every cell group at the same instant; it reports them in rotation, and a full sweep takes a couple of seconds. If pack voltage is steady, that does not matter. If pack voltage is moving, the highest and lowest readings in a sweep were taken at different moments, and the difference between them is partly just the pack changing while it was being read.
Which predicts something specific: the worst apparent spread should come not from the largest current, but from the fastest-changing one. That is exactly what the data shows, and it is why a stop-start drive measures worse than a supercharge.
Neither of these is a defect appearing. One is Ohm’s law and the other is a sampling artifact.
263 days of a very boring line
Here is the resting cell spread on my car, every day from 1 January to 20 September 2026 — 263 consecutive days with no gaps.
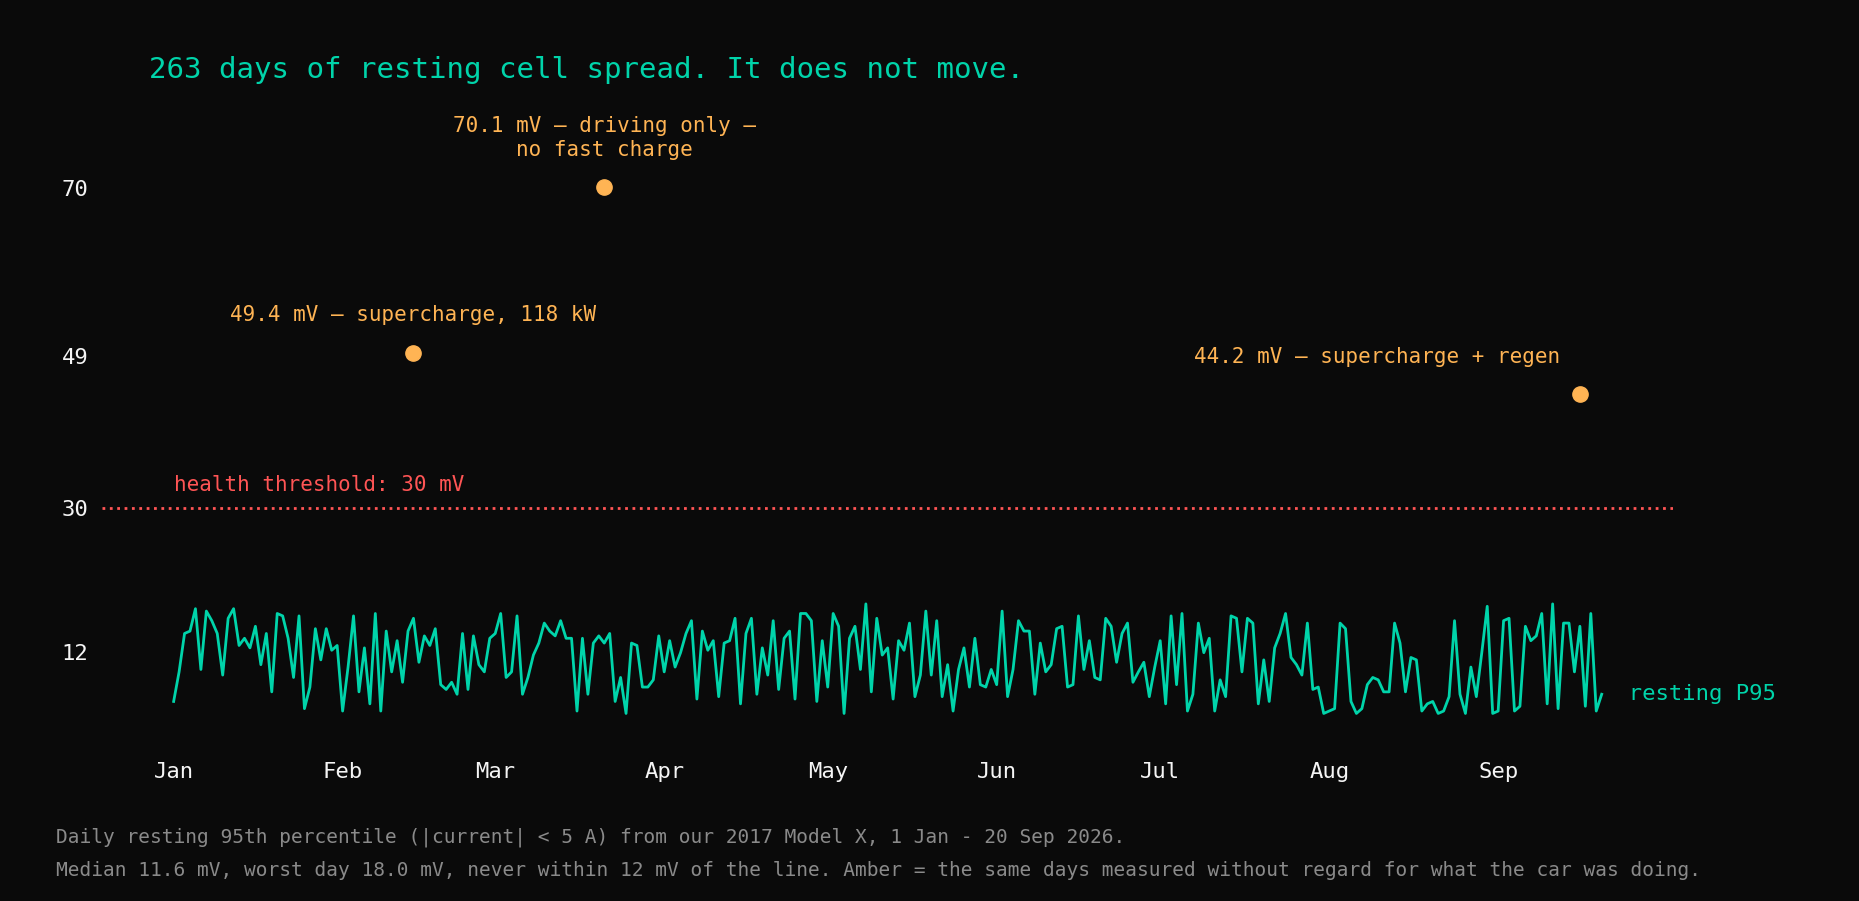
| Resting 95th percentile | Resting median | |
|---|---|---|
| Median across 263 days | 11.6 mV | 6.1 mV |
| Best day | 4.3 mV | 3.0 mV |
| Worst day | 18.0 mV | 14.9 mV |
| Threshold | 30 mV | 25 mV |
| Days above threshold | 0 | 0 |
It also got slightly better over the run: the 95th percentile ran a median of 14.0 mV across the first 30 days and 9.8 mV across the last 30. I would not read a recovering pack into that — it is more likely seasonal temperature and charging habits — but it is certainly not a pack drifting apart.
This is what a healthy signal looks like. It is boring, and boring is the product.
The three days it wasn’t boring
Now the same 263 days, measured the naive way — highest spread seen at any moment, regardless of what the car was doing. That was the number the monitor used to judge on, against a 40 mV threshold, and it crossed on exactly three days:
| Date | All-conditions spread | What the car was doing |
|---|---|---|
| 14 Feb | 49.4 mV | Supercharging, 118 kW, 22% → 52% |
| 21 Mar | 70.1 mV | Driving — two discharge stretches around 20 kW |
| 16 Sep | 44.2 mV | Supercharging, 111 kW, 31% → 49% |
Three crossings, three days with heavy current flowing, zero days of anything wrong with the pack. On every one of those three days the resting median sat in its normal range — 14.3 mV, 10.4 mV and 9.5 mV respectively.
And here is the part that stings: the resting number was already being computed, every day, in the same file. The gate that separates resting samples from the rest has been in that code since long before this incident. The monitor had the right number available and was judging on the wrong one.
The 21 March row is the one that broke my first explanation. I had assumed fast charging was the cause, and 21 March has no fast charge on it at all — the car was simply driven, pulling around 20 kW in two stretches. Yet its high-current spread reached 127.2 mV, higher than either supercharging day.
That sent me back to separate the two conditions properly, which is where the real finding was. The lesson is broader than superchargers: the metric was not measuring pack health. It was measuring how hard, and how abruptly, the car was working.
One afternoon, three numbers
16 September is the cleanest illustration, because all of it happened within a few hours on the same pack:
| Condition | Cell spread (95th percentile) |
|---|---|
| Under regen, driving | 136.9 mV |
| Taking a 111 kW supercharge | 73.8 mV |
| Shortly after the charge ended | 14.9 mV |
| At rest | 15.2 mV |
| At rest (median) | 9.5 mV |
A factor of fourteen between the top and the bottom, with nothing happening to the battery in between except current.
Run the arithmetic on the supercharge row and it is unremarkable: 111 kW at pack voltage is roughly 280 amps, and 73.8 mV across 280 amps works out to about a quarter of a milliohm of difference between the strongest and weakest brick. That is ordinary variation in a pack of this age. It is not a finding.
And note which row is on top. Regen measured nearly twice the supercharge, on the same afternoon, on the same pack. A supercharge pushes a large but steady current; regen delivers short violent bursts. If apparent spread tracked current alone, the supercharge would win. It tracks how fast the current is changing, which is the sampling artifact described above.
The supercharge signature that didn’t move
Separating the two conditions on every fast-charging day in the run makes the pattern hard to argue with:
| Date | Supercharge window | Regen, same day |
|---|---|---|
| 14 Feb | 74.7 mV | 151.0 mV |
| 14 Jun | 83.0 mV | 72.0 mV (only 11 samples — ignore) |
| 16 Sep | 73.8 mV | 136.9 mV |
Two things fall out of that table.
The first is the regen column, already covered. The second is quieter and more interesting: the supercharge column barely moves. 74.7 mV in February, 83.0 mV in June, 73.8 mV in September — seven months apart, at different temperatures, different states of charge and different charge rates, landing within about 10 mV of each other.
That consistency is itself a health signal. A pack developing a weak cell group would show a rising spread under the same load, because the resistance term grows. This one is flat. The number is useless as a threshold and genuinely useful as a trend, which is precisely why it is now kept as a diagnostic rather than thrown away.
What we changed, and why it took a false alarm to find it
The monitor that flagged my pack on 16 September was doing something defensible on paper: take the spread readings for the day, compute a high percentile, compare it to a threshold. What it was missing is that those readings are not comparable to each other. Mixing a supercharge into a day’s resting data and taking a percentile produces a number that describes neither.
The fix, shipped the following day, was not a threshold change. Raising the threshold until the false alarm disappears is how you go deaf:
- Every sample is now tagged with what the car was doing when it was taken — at rest, fast-charging, or driving and regenerating.
- Pack consistency is judged only on resting samples — the family of numbers in the table above. The health verdict now hangs on the resting 95th percentile, against a 30 mV line.
- The charging spread is kept, but as a diagnostic, not a verdict. It is genuinely interesting — a resistance signature that would be worth watching over years — but it never raises an alert.
- A single day never surfaces. A flag has to persist across multiple days in a week before it is shown as anything other than normal.
After that change, 16 September reads normal, which it always should have. You can see the same system running live on the garage page — that is this car, updated daily, including the days it has nothing to report.
The archive was not left disagreeing with the code. The resting 95th percentile did not exist before 16 September, and 14 February and 21 March still carried the observe they were given under the old rule — verdicts nobody ever saw, because a single day does not surface. So the whole history was recomputed: 263 days, about two and a half hours, every number in this post drawn from the result.
Cell spread now reads clean on all 263 days. Two days are still not normal, and both are other metrics entirely — 20 May flagged pack internal resistance at 116.4 mΩ against a 100 mΩ line, and 9 September flagged a cell temperature of 73 °C against a 50 °C line. Neither persisted, neither surfaced, and neither is the subject of this post. I am listing them because “we recomputed and everything went green” is the kind of sentence that should make you suspicious, and it would not have been true.
If you are reading your own numbers
You do not need our monitoring to avoid this mistake. You need three pieces of context that a single reading does not carry:
- Was current flowing? A spread captured while charging or driving is expected to be several times the resting figure. Read it parked and settled, ideally after the car has been sitting a while.
- What was the state of charge? Spread varies across the SoC range, and it is widest at the extremes. Compare like with like — a reading at 30% and a reading at 80% are not the same measurement.
- Does it persist? One reading is noise. The signal is a resting spread that climbs week over week. That is the shape that means something, and it is the only shape worth acting on.
Which is the same argument as why a good monitor should almost never alert you, and the same one as the isolation alarm we didn’t send. A measurement system earns trust by what it declines to tell you. My own system failed that test on 16 September, which is why it now tags every sample before it judges any of them.
If you want the longer version of “trend, not single point”, the battery health test versus OBD data piece is about exactly that argument applied to capacity instead of balance, and normal degradation rates covers what the capacity trend itself should look like.